Storm Event
'The biggest event to impact the UK east coast for more than half a century. Much flooding and damage, particularly in the northeast, but a repeat of the 1953 damage levels was prevented'
Source
Storm “Xaver” developed off the southeast Greenland coast on 3rd December 2013 and moved in an eastward direction towards the UK. On 5th December, the storm passed over north Scotland and combined with, and was enhanced by, another low-pressure system located over the Norwegian Sea. The pressure dropped rapidly to 960 mbar as the storm crossed the North Sea and passed into Scandinavia and then Eastern Europe on 6th December. Hurricane force wind gusts were recorded.
The storm generated a skew surge of over 1 m in the Irish Sea and up to 2 m in the North Sea. Skew surges in the eastern English Channel were between 0.5 and 0.75 m. Water levels exceeded the 1 in 5 year return level at 12 sites in these regions. At 9 of these sites the water level was the highest on record. The highest return period water level was at Dover and was 1 in 843 years. The highest skew surge was at Lowestoft and was 1.93 m (approximately a 1 in 200 year return period skew surge). The high water took 9 hours to travel from Aberdeen to Dover. The storm surge passing into the English Channel caused the largest water level on record at Newhaven and at Portsmouth, with a skew surge value of 0.73 m and 0.69 m, respectively. West of these gauges, the surge continued to propagate westwards through the morning of 6th December, but without causing extreme high waters beyond the Solent. In many instances, the high water levels observed in 2013 exceeded those during the notorious 1953 event, due mainly to the larger astronomical tides in 2013 (Wadey et al., 2014; Wadey et al., 2015).
Maximum significant wave heights along the east coast were highest off the North Norfolk coast (almost 4 m offshore), and lowest along the Suffolk coast (Spencer et al., 2015).
Pathway
This was a complex event which produced at least 50 separate incidences of breached (natural and manmade) defences across the UK coastline as well as multiple incidences of overtopping.
Receptor and Consequence
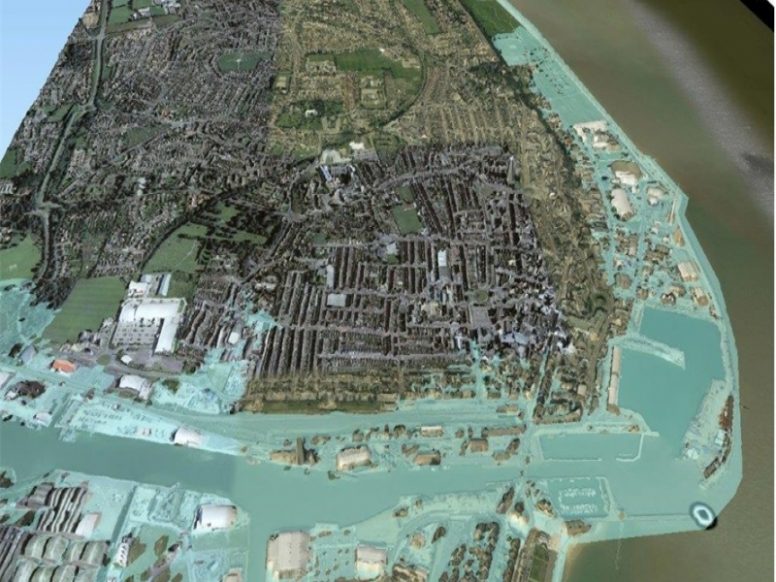
This was reportedly the worst coastal flooding event in the UK since the disaster of 1953. A detailed description of this event is provided by Spencer et al. (2014; 2015) and Wadey et al. (2015). There was intense media coverage of this event and it had prompted comparisons with the event of 31st January – 1st February 1953. The event coincided with the other significant news of the death of Nelson Mandela. Across Northwest Europe, by 7th December 2013, this storm had left 15 persons dead and dozens injured. There were no reported fatalities from coastal flooding (AON Benfield, 2014). Initial estimates from the Environment Agency (EA) indicated consequences including seawater inundation to 1,400 homes, 1,000 businesses and 3,200 hectares of farmland. Over 10,000 people were evacuated along the east coast, and approximately 800,000 properties are reported to have been protected by flood defences along 2,800 km of UK coastline (Zurich, 2014). Around 2,800 properties were flooded across the UK (Wadey et al., 2015). Model estimates suggest insured losses across the event were in the range of €1.4 to €1.9 billion, including wind losses and storm surge-related flooding. According to a ‘flood footprint’ map showing seawater flood depths (with a resolution of 5 m over an area of approximately 2,500 km2 and covering a length of 1,500 km of coastline), locations listed as flooded from wave overtopping included: Boston, Great Yarmouth, Lowestoft, North Berwick, Jaywick, North Wales, Blackpool, Cleveleys, Walcott, Cromer, Whitstable, Portgordon and New Brighton (JBA, 2014). Numerous reports of the floods are available via major news agencies.
Summary Table
| Loss of life | * |
| Residential property | Around 2,800 properties were flooded |
| Evacuation & rescue | Approximately 18,000 persons from around the country were evacuated |
| Cost | Estimated cost of damages to property and that incurred by the Environment Agency was under £0.5 billion |
| Ports | The port of Immingham was closed for several days when key infrastructure was impacted by flood water |
| Transport | 160 km of rail and 190 km of roads were affected by flooding |
| Energy | * |
| Public services | * |
| Water & wastewater | * |
| Livestock | Around 700,000 heads of livestock were killed |
| Agricultural land | Approximately 68 km2 was inundated |
| Coastal erosion | There was considerable erosion, most notably along the east coast which drew comparisons to the disaster of 1953 |
| Natural environment | * |
| Cultural heritage | * |
| Coastal defences | There were around 50 breaches to defences around the UK |
Affected Sites
| Name | Return Period ? | Water Level ? | Tide ? | Skew Surge ? | Date ? |
|---|---|---|---|---|---|
| DOVER | 843 | 8.44 | 6.81 | 1.63 | 6th Dec 2013 00:45 |
| IMMINGHAM | 787 | 9.11 | 7.49 | 1.61 | 5th Dec 2013 19:15 |
| WHITBY | 568 | 7.31 | 6.08 | 1.23 | 5th Dec 2013 17:15 |
| NORTH SHIELDS | 405 | 6.57 | 5.42 | 1.15 | 5th Dec 2013 16:15 |
| LOWESTOFT | 188 | 4.76 | 2.79 | 1.97 | 5th Dec 2013 22:30 |
| LIVERPOOL | 43 | 11.14 | 9.96 | 1.18 | 5th Dec 2013 12:30 |
| NEWHAVEN | 39 | 7.79 | 7 | 0.78 | 6th Dec 2013 01:15 |
| LEITH | 21 | 6.6 | 5.74 | 0.86 | 5th Dec 2013 15:15 |
| ABERDEEN | 20 | 5.22 | 4.6 | 0.62 | 5th Dec 2013 15:00 |
| LLANDUDNO | 15 | 8.91 | 8.2 | 0.7 | 5th Dec 2013 12:00 |
| PORTSMOUTH | 12 | 5.56 | 4.87 | 0.69 | 6th Dec 2013 01:00 |
| ULLAPOOL | 9 | 6.25 | 5.43 | 0.81 | 5th Dec 2013 07:15 |
We rely on submissions from the public to maintain these images. If you witnessed this event, please help by uploading your photos.
References
- Wadey, M.P., Haigh, I.D. and Brown, J.M., (2014). ‘A century of sea level data and the UK’ s 2013/14 storm surges: an assessment of extremes and clustering using the Newlyn tide gauge record’. Ocean Science, 10(6), pp.1031–1045. Available at: http://www.ocean-sci.net/10/1031/2014/os-10-1031-2014.html (Accessed: 3 March 2015)
- Wadey, M. P., Haigh, I. D., Nicholls, R. J., Brown, J. M., Horsburgh, K., Carroll, B., Gallop, S. L., Mason, T. and Bradshaw, E. (2015). ‘A comparison of the 31 January–1 February 1953 and 5–6 December 2013 coastal flood events around the UK’. Frontiers in Marine Science, 2. Available at: http://journal.frontiersin.org/article/10.3389/fmars.2015.00084/abstract (Accessed: 14 March 2016).
- Spencer, T. et al., (2015). ‘Southern North Sea storm surge event of 5 December 2013: Water levels, waves and coastal impacts’. Earth-Science Reviews, 146, pp.120–145. Available at: http://www.sciencedirect.com/science/article/pii/S0012825215000628.
- Spencer, T., Brooks, S. M., Möller, I. and Evans, B.R., (2014). ‘Where Local Matters: Impacts of a Major North Sea Storm Surge’. Transactions American Geophysical Union, 95, pp.269–270.
- Spencer, T. et al., (2015). ‘Southern North Sea storm surge event of 5 December 2013: Water levels, waves and coastal impacts’. Earth-Science Reviews, 146, pp.120–145. Available at: http://www.sciencedirect.com/science/article/pii/S0012825215000628.
- Wadey, M. P., Haigh, I. D., Nicholls, R. J., Brown, J. M., Horsburgh, K., Carroll, B., Gallop, S. L., Mason, T. and Bradshaw, E. (2015). ‘A comparison of the 31 January–1 February 1953 and 5–6 December 2013 coastal flood events around the UK’. Frontiers in Marine Science, 2. Available at: http://journal.frontiersin.org/article/10.3389/fmars.2015.00084/abstract (Accessed: 14 March 2016).
- AON Benfield, (2014). December 2013 Global Catastrophe Recap, Available at: http://thoughtleadership.aonbenfield.com/Documents/20140107_if_december_global_recap.pdf.
- Zurich, (2014). After the storm: how the UK’s flood defences performed during the surge following Xaver, Zurich, Switzerland. Available at: http://www.preventionweb.net/publications/view/39185 (Accessed: 18 November 2015).
- JBA, (2014). UK Xaver flood event footprint – December 2013, Skipton, North Yorkshire. Available at: http://www.jbarisk.com/our-datasets/event-and-scenario-footprints


